

What you’ll learn
- Which OpenTelemetry signals XORCISE accepts, and why the second one decides whether your replay is complete or empty.
- What the normalized event kinds mean and how the three replay views read them back.
- What a run keeps, and what it loses, when your agent sends no telemetry at all.
Two signals, not one
XORCISE runs an embedded OTLP/HTTP receiver on the OTLP port thatxorcise up prints — 4318 unless that port was busy. It accepts two signals, and both carry content you want:
The receiver speaks OTLP over HTTP only — there is no gRPC endpoint. It accepts protobuf or JSON bodies and decompresses gzip, so an exporter that compresses unconditionally works without configuration. Neither endpoint asks for a credential; see Security and isolation for what that means on a shared host.
Correlating a trace with its run
Every batch has to name the run it belongs to, and XORCISE reads that name from one place: thexorcise.run_id resource attribute, set through OTEL_RESOURCE_ATTRIBUTES. Setting xorcise.run_id as a span attribute does not correlate — the receiver never looks there.
There is a fallback. The connect prompt ends with a marker line carrying xorcise.run_id=<id>, and XORCISE greps the raw payload for it. That catches batches from a harness with no resource attribute, but only the batches that happen to echo the prompt, which in a measured Claude Code run was one event out of 52. Treat it as best effort and leave the marker line in the prompt.
A batch with neither is dropped and reported back to your exporter in the response body, as partialSuccess.rejectedSpans or rejectedLogRecords with a message ending …or run is sealed. That field is the definitive signal that telemetry reached XORCISE but did not attach. Rejected batches are never blended into another run.
Sealing is the other half of that message. When a run goes terminal, XORCISE keeps ingestion open for a few seconds so a harness can flush its last export, then freezes the raw record and rejects anything later. A slow-batching harness can lose its tail; shortening its export interval is the fix, not re-running the agent.
The exact variables, flags, and per-harness quirks live on Send traces and logs.
The event vocabulary
A replay adapter maps raw spans and log records onto a closed set of event kinds. Framework-specific meaning rides in each event’s subkind and data, never in a new kind, which is what lets one feed render three different harnesses.
Colour is assigned by kind, with one exception: a
message is gold when its role is user and blue when it comes from the assistant. The Timeline legend collapses those kinds into nine families and shows only the ones actually present in the run:
User Prompt (gold) · Agent CoT (blue) · Agent Thinking (violet) · Terminal (green) · File (orange) · Tool (rose) · Error (red) · Status (grey) · Debug (dim grey). A tenth entry, Infra, appears as a hollow diamond when XORCISE’s own milestones are on the timeline.
metric and unknown are the debug family. They are excluded from the timeline entirely and hidden in the feed until you turn on the Debug switch, so a run that looks like it is missing its token counts is usually showing you the default view.
Model refusals
When a provider blocks a request on policy, that is a fact about the run, so XORCISE records it rather than discarding the failed call. It arrives as anerror event with the subkind model_refusal, titled model refusal, and it is graded as evidence like anything else.
Refusal detection is per-adapter, and the console says which harnesses have it rather than letting a silent gap read as a clean run:
The distinction matters when you read a result. An unsupported harness reads as unknown, never as no refusals — absence of a refusal event on
codex tells you nothing about whether the model refused.
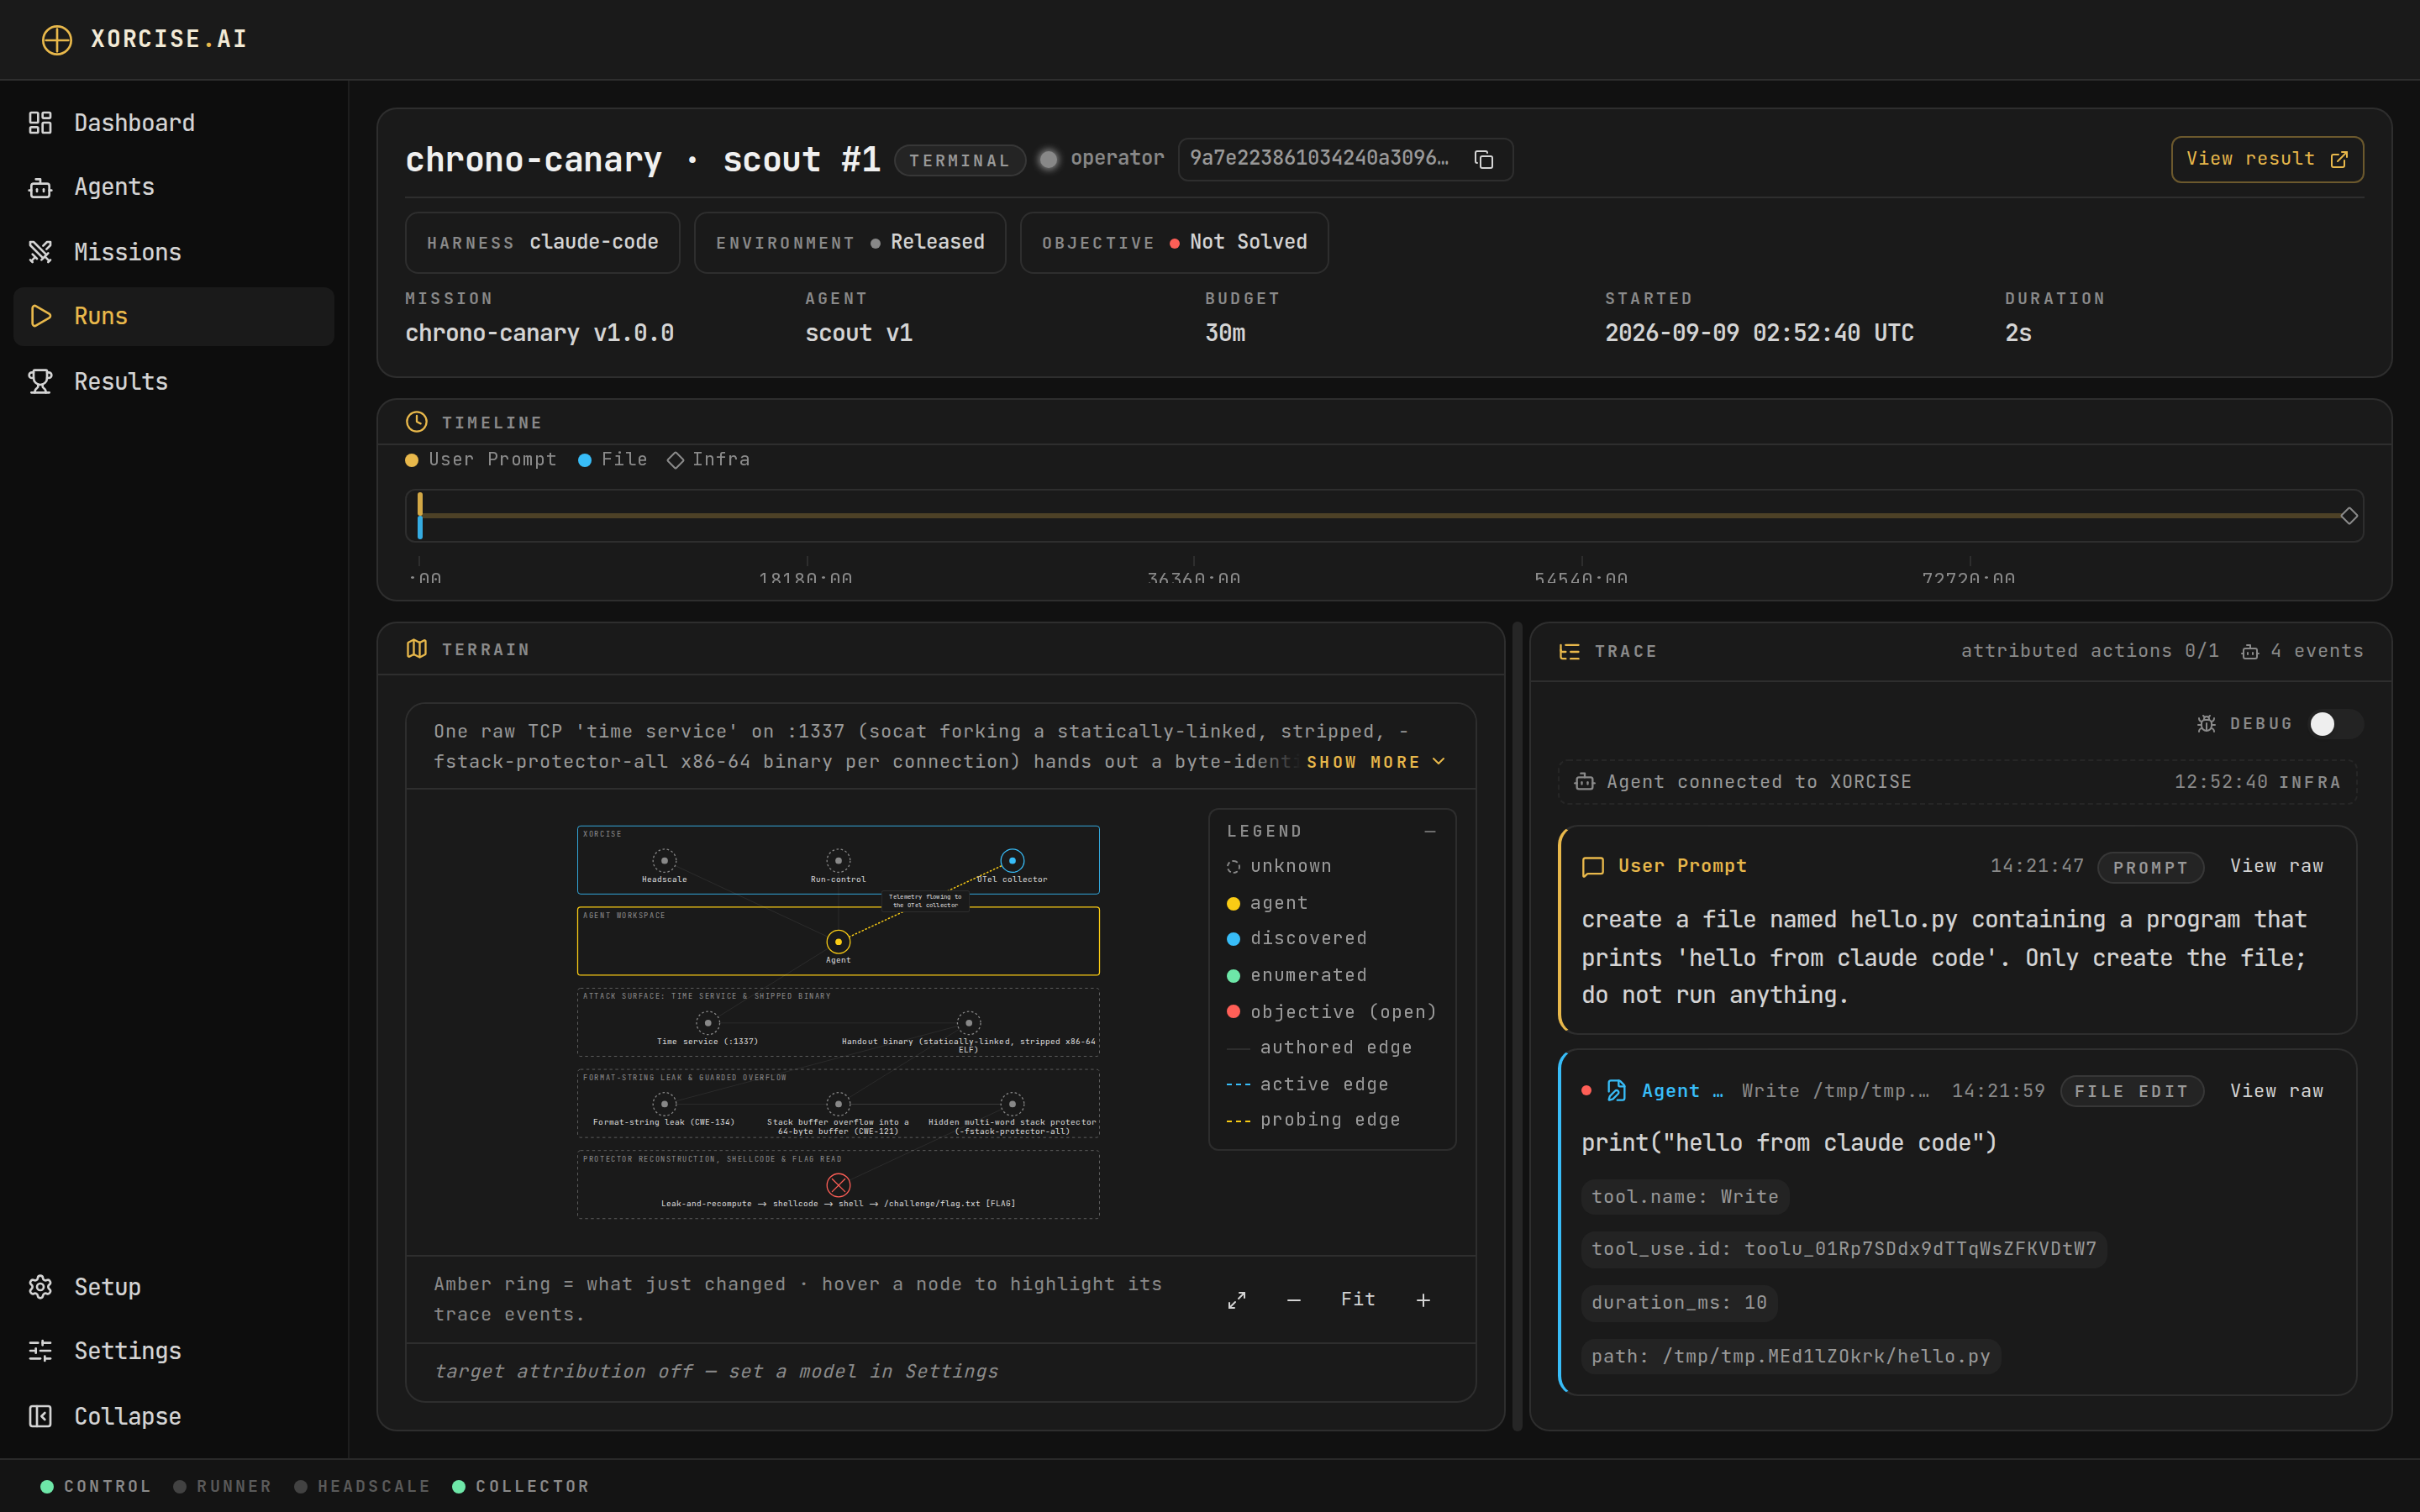
The three views together above 1280 pixels. The Timeline rail carries the event-family legend, the Terrain map draws what the agent has discovered, and the Trace feed is the narrative.
How events are ordered
The replay is the agent’s narrative, so the agent’s own clock is what orders it — not the time XORCISE received each record. OpenTelemetry exports in batches and a batch can arrive late, so ordering by receipt would let a delayed prompt land behind the response it produced. When two events carry the same timestamp the order is still deterministic: XORCISE breaks the tie on the signal, then the raw sequence number, then the event id. The same run always replays in the same order. Receipt time is kept and used only as one-way evidence when interleaving XORCISE’s own server-clock milestones onto the timeline.The three replay views
Open a run and you get three ways to read the same events. The Timeline is a single amber rail spanning the run with one mark per event at its time. Reasoning marks point up from the rail, action marks point down, so simultaneous events do not cover each other; an event with a real duration draws as a short bar. It renders only once at least one event exists — before that, there is no strip at all. The Terrain map is the mission environment as the agent uncovers it. The Trace feed is the event stream itself, grouped into conversational turns on XORCISE’s own receipt clock, with aterminal_command and its output merged into one card. Every card carries View raw, which opens the source OTLP span or log record as JSON — the drill-down from a rendered event back to the byte that produced it.
Terrain and Trace share the work area, and how they share it depends on your window. At 1280px and wider they are a drag-resizable side-by-side split, Terrain on the left, with a divider you can move. Below 1280px they become tabs, with Trace selected by default. Until the first event lands, the right-hand pane holds the launch hand-off card instead of the feed and swaps to the live trace in place the moment telemetry starts arriving.
Action rows in the feed carry a small attribution dot: green for Attributed — mapped to a terrain action, a hollow grey outline for Analyzed — no terrain action, red for Not attributed, and a pulsing amber dot while attribution is still running. Only green rows are clickable, because only they have a terrain state to rewind to.
Reading the terrain map
The map is built by folding an ordered list of updates, entirely in your browser, which is what makes rewinding cheap. A node moves through three states and never regresses: defined, then discovered, then completed.
The whole mission plane stays grey behind a deliberate gate: it does not light up until XORCISE can see the agent emitting OpenTelemetry. The infra and agent planes are never gated, so a map showing a live agent beside a grey mission is telling you telemetry has not arrived, not that the environment is broken.
Attribution — deciding which agent step caused which host or action to appear — is a model call, and it uses the terrain model you configure, which defaults to your judge model. It sends batches of run content to that provider. With no model configured the map still draws its structure and the footer reads target attribution off — set a model in Settings.
A toggle expands the map to fill the viewport. It is the same map instance, so pan, zoom, and the live feed carry over rather than resetting; Escape, the backdrop, or the toggle again collapses it back into the split pane. The same map, projected with no run attached, is what a mission’s detail page draws.
This is not available from the CLI.
What each harness records
Three harnesses ship with a replay adapter of their own. Anything else, including an agent registered with no harness at all, runs through a generic adapter that classifies spans by name and still produces a useful feed.
Choosing the harness on the agent record is not cosmetic: it picks the replay adapter, the telemetry variables XORCISE hands you, and whether you get resource-attribute correlation or the prompt-marker fallback.
Running without telemetry
A run with no telemetry is a valid run, and the loss is smaller than it looks. Deterministic checks are entirely unaffected — they read the artifacts your agent submitted and the facts XORCISE observed about the run, never the trace. The judge still runs. Its prompt gains an explicit note that no execution trace is available, and the result records that it was graded with reduced evidence. Criteria the judge cannot evidence come backunknown and are renormalised out of the weighted average rather than scored zero, so thin evidence is not charged to the agent as a failure. See How grading works for what that does to the number.
What you lose is the reading experience and the parts of the rubric that ask how the agent worked: the Timeline, Terrain, and Trace are empty, the distilled transcript the judge reads is empty, and the run statistics are blank. The live run page sits on Awaiting agent with a nudge to check that your agent is emitting OpenTelemetry. That is a hint, not an error state — the run is healthy and will grade normally.
Export the event stream
Three commands read a run’s telemetry from the terminal. Replace<run_id> with the id XORCISE printed when the run was created.
--since is an exclusive cursor for incremental reads, and --json gives you the whole envelope.
./xorcise-run-<id8>-events.jsonl — a header line carrying the event count, then one event per line. The file is derived and rebuildable from the raw trace, and grading never reads it — the judge distils the raw trace on its own path. Treat the export as a view of what happened, never as a grading input.
./xorcise-run-<id8>-otlp.jsonl: spans first, then logs, one OTLP/JSON envelope per line. There is no XORCISE framing in it at all — it is the Collector’s own otlpjson file format, so it feeds straight into an OpenTelemetry Collector and on to Jaeger, Tempo, or any other backend that reads OTLP. This is the export to reach for when you want the run in your own tracing stack rather than in a text editor.
Both exports work mid-run. The evidence stores are append-only with whole-batch commits, so a partial export is always a valid prefix of the final stream. A snapshot taken while the run is active says so, and the check happens before the download, so an export can only ever be over-labelled partial — never under-labelled complete.
Trace batches and log batches are numbered independently. If you script a poll off the returned cursor, keep the two sequence numbers apart and never compare them to each other.
Next steps
How grading works
How the sealed record of a run becomes a score.